62% Higher ROAS on 9% More Spend for a US Home Electronics Store
01The client
| Project | E-commerce – home electronics & appliances (under NDA) |
| Markets | United States |
| Period | Aug 2026 – Sep 2026 |
| Platform | Google Ads |
| Service | Google Ads – E-commerce |
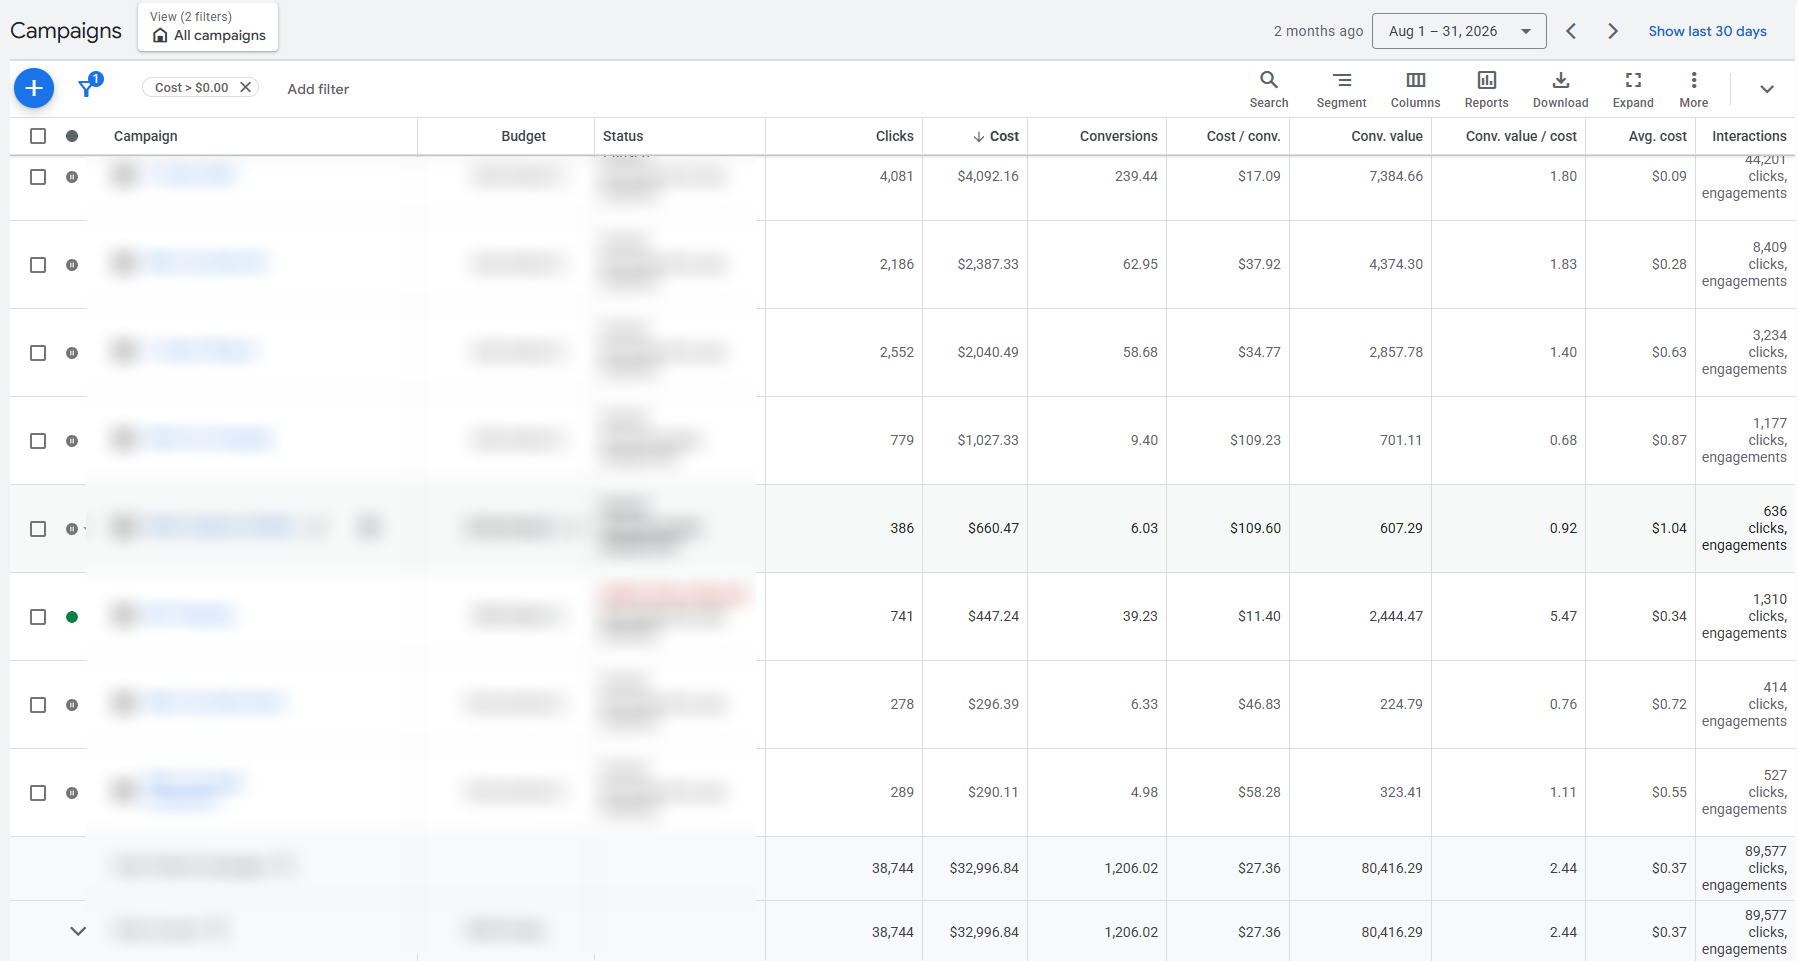
A US online store selling home electronics and household appliances. Google Ads brought steady volume – about 1,200 purchases a month – but thin returns: in August, the month we took it over, the account spent $32,997 and got back $2.44 for every dollar.
Returns varied widely between campaigns, and spend didn’t follow them. We joined three weeks before the end of August and spent the first week on the audit. What had to change:
- Raise the return on ad spend without losing purchase volume
- Stop funding campaigns that return less than they cost
- Put the budget behind the products that bring the most per order
02What the audit found
Purchase tracking was correct, so the conversion setup stayed as it was. The problems were in bidding and structure:
- Spend didn’t follow returns. Three campaigns returned less than they cost – $0.68 to $0.92 per dollar – and together took $1,984, 6% of August’s spend. A campaign returning $5.47 per dollar got 1.4%.
- Bid targets at the extremes. Set too tight, a target stops a campaign from spending. Set too loose, Google buys expensive conversions. Several campaigns sat at one of the two ends.
- No segmentation by product. Cheap and expensive products shared campaigns and budgets, so nothing pushed the items that bring the most per order.
- The same products in several campaigns. One product could show from different campaigns at different bids.
- No routine clean-up. Search terms, creatives and audiences weren’t reviewed on a schedule.
Tracking counted every order. Nothing in the setup steered the budget toward the valuable ones.
03What we rebuilt
From week two we rebuilt bidding and structure:
- Target ROAS. Bidding moved to Target ROAS, so Google weighs each order by what it is worth, not only whether it happened.
- Products split by value. Higher-priced products were separated out and given their own budget instead of competing with cheap ones for the same money.
- Budget moved to return. Spend left the campaigns returning less than they cost and went to the ones with the highest return.
- Cross-exclusions. Each product went to one campaign and was excluded from the others.
- Clean-up on a schedule. Search terms, creatives and audiences are reviewed regularly; whatever doesn’t sell gets cut.
04The results
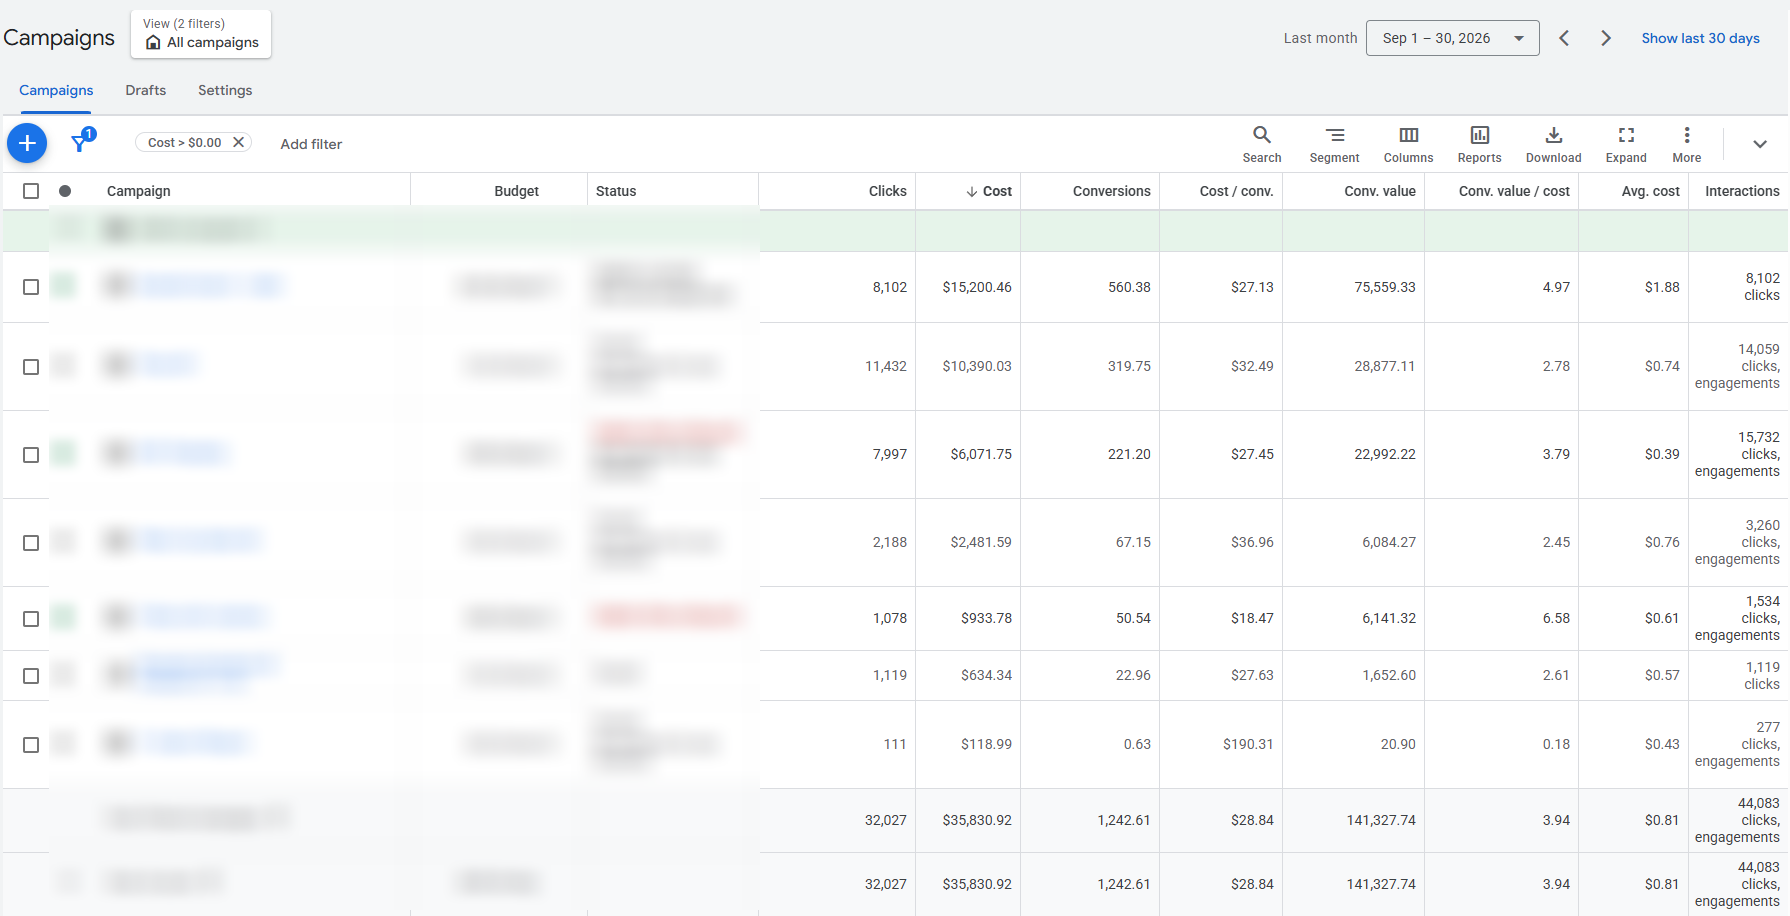
September vs August. Purchases barely moved – up 3%. What changed is what each purchase was worth.
- ROAS
- 2.44 → 3.94 (+62%)
- Conversion value
- $80,416 → $141,328 (+76%)
- Average order value
- $66.68 → $113.73 (+71%)
- Purchases
- 1,206 → 1,243 (+3%)
- Ad spend
- $32,997 → $35,831 (+9%)
- Conversion value per click
- $2.08 → $4.41 (2.1x)
05What it meant for the margin
Google Ads stops at conversion value. To put the change in money terms, the table below is modelled: three possible gross margins applied to the measured ROAS. “Left per $1” is the gross profit from the sales minus the ad dollar itself. We don’t know the client’s margin, and the model leaves out returns, shipping and fixed costs.
| Gross margin (assumed) | Break-even ROAS | Aug 2026: left per $1 | Sep 2026: left per $1 |
|---|---|---|---|
| 30% | 3.33 | -$0.27 | +$0.18 |
| 40% | 2.50 | -$0.03 | +$0.58 |
| 50% | 2.00 | +$0.22 | +$0.97 |
At a 30–40% margin, August’s ads sold at a loss or close to break-even. At any margin from 30% to 50%, each ad dollar in September paid for itself and left $0.18 to $0.97 on top.
06Why it worked
Purchases didn’t get cheaper. Cost per purchase rose 5%, from $27.36 to $28.84, and a click got 31% more expensive. On those numbers alone, September looks like a worse month.
What changed is the size of the order: $66.68 on average in August, $113.73 in September. Target ROAS made Google weigh each order by its value, and the separate budget for higher-priced products gave it more of those orders to win.
That is why fewer, pricier clicks came out ahead. Clicks fell 17%, the share that ended in a purchase rose from 3.1% to 3.9%, and each click brought $4.41 in conversion value instead of $2.08.
If ROAS is stuck while order volume looks healthy, the fix is rarely more orders. It is choosing which orders the account bids for.
