11% More Leads on 20% Less Google Ads Spend for a US Industrial Company
01The client
| Project | Industrial company (under NDA) |
| Markets | United States, nationwide |
| Period | Aug 2026 – Sep 2026 |
| Platform | Google Ads |
| Service | Search & PPC – Lead Generation |
A US industrial company selling nationwide. A typical order runs to several thousand dollars, and B2B deals reach tens of thousands and more. Leads come in two ways – a phone call or a form – and Google Ads tracks both.
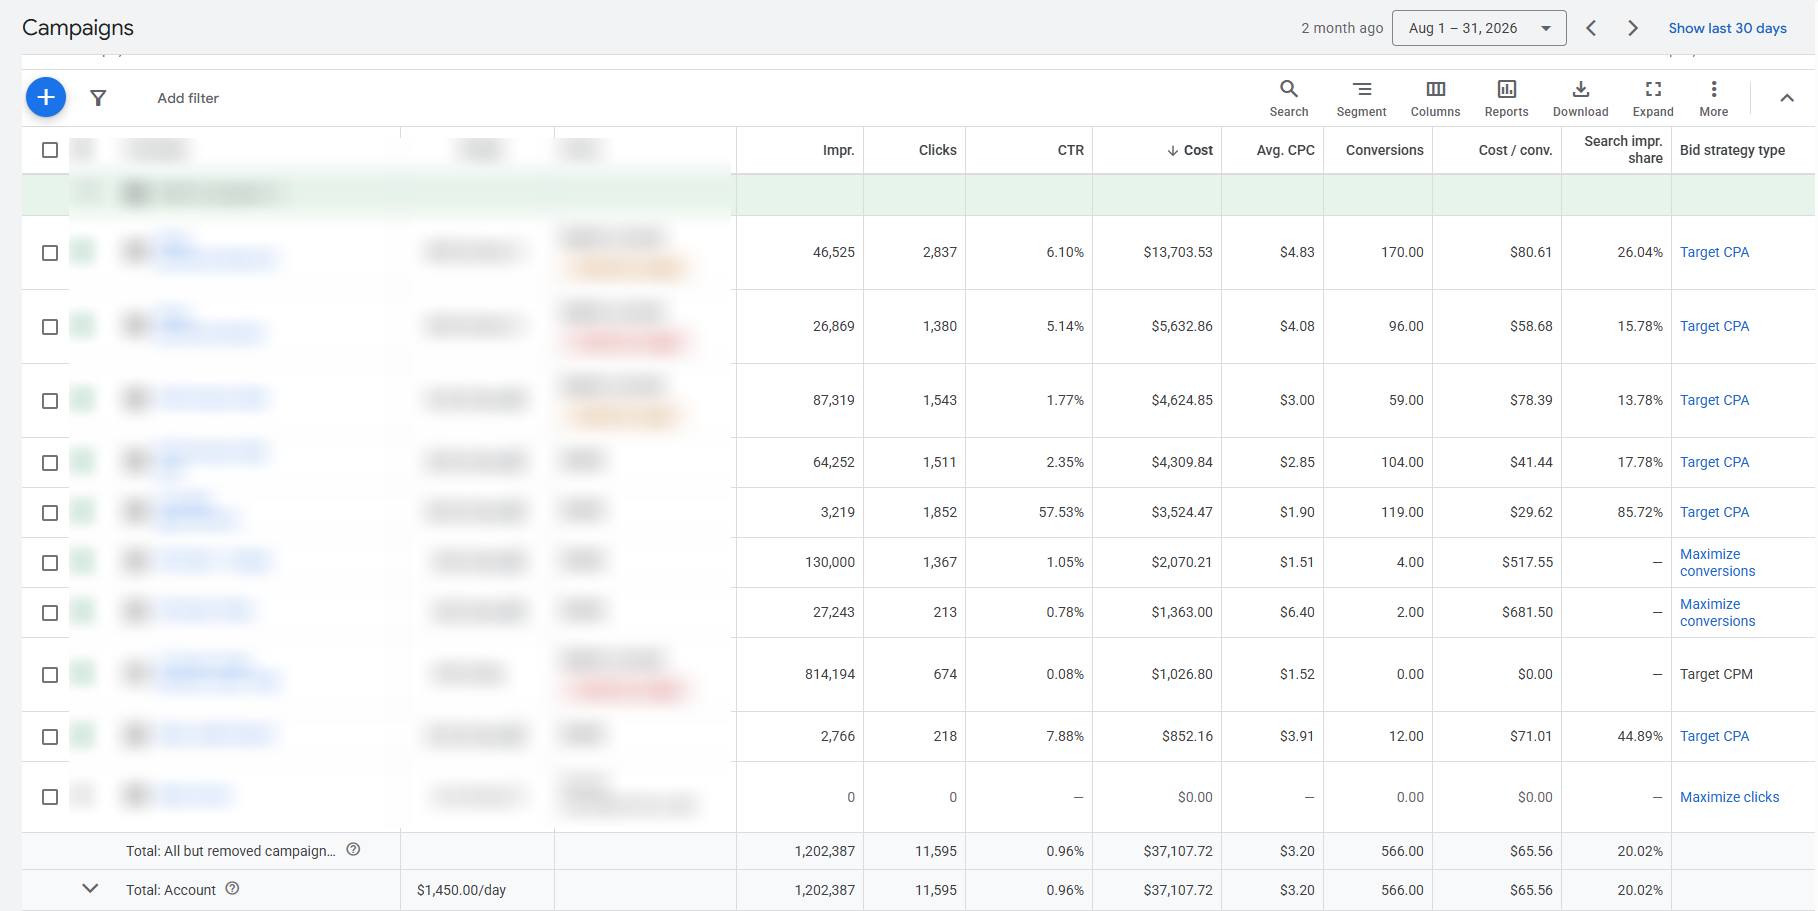
The Google Ads account had worked before. Over time it got more expensive: budget kept flowing to campaigns that weren’t converting, on the hope they would pick up, while the campaigns that did convert were short of money. In August – the month we took it over – it spent $37,108 and brought in 566 leads at $65.56 each.
We joined three weeks before the end of August. For the first week we changed nothing – only the audit and the plan. What had to change:
- Find out why the account kept getting more expensive
- Bring cost per lead down without losing lead volume
- Stop funding campaigns that don’t convert
- Put the budget behind the campaigns that actually sell
02What the audit found
The first week was audit only. Tracking was fine – calls and form submissions were counted correctly, so the conversion setup stayed as it was. Five problems sat in how the account spent money:
- Bid targets at the extremes. On Target CPA, a target set too low stops a campaign from spending; one set too high lets Google buy expensive conversions. Several campaigns sat at one of the two ends.
- Mixed campaigns. Keywords and audiences with different intent shared the same campaigns. No single budget or bid target fit all of them, and no report could tell them apart.
- Budget kept where it didn’t work. Campaigns that hadn’t converted for months still kept their budget, on the hope that they would pick up, while some that converted well were short of it.
- No cross-negatives. The same keywords sat in several campaigns, so one search could land in any of them – each with its own bid and ad.
- No routine clean-up. Search terms weren’t reviewed on a schedule, and creatives and audiences that didn’t convert were never switched off.
None of these is a single big mistake. Together they meant the account kept paying more for the same result.
03What we rebuilt
From week two we changed how the account spends:
- Targets reset campaign by campaign. Where a target choked spend or overpaid, we changed the bidding strategy. Elsewhere we adjusted the settings and let the campaign go through learning again.
- One intent per campaign. Mixed campaigns were split, so keywords and audiences with different intent no longer share a budget or a bid target.
- Budget follows sales, not cost per lead. Money moved out of campaigns that hadn’t converted for months. The main campaign had the most expensive leads but, by the client’s cancellation data, the cheapest completed sales – so it kept most of its budget, and part of it moved to other campaigns step by step.
- Cross-negatives. Each overlapping keyword went to one campaign and was excluded from the rest, so a search lands where it is meant to.
- Clean-up on a schedule. Search terms, creatives and audiences are reviewed regularly; whatever doesn’t convert gets cut.
- Two awareness tests. A video campaign and one with creatives aimed at competitors’ audiences, capped at 5–7% of budget, to see whether they lift branded and direct searches. The test is still running, so its spend sits in the totals with no leads against it.
04The results
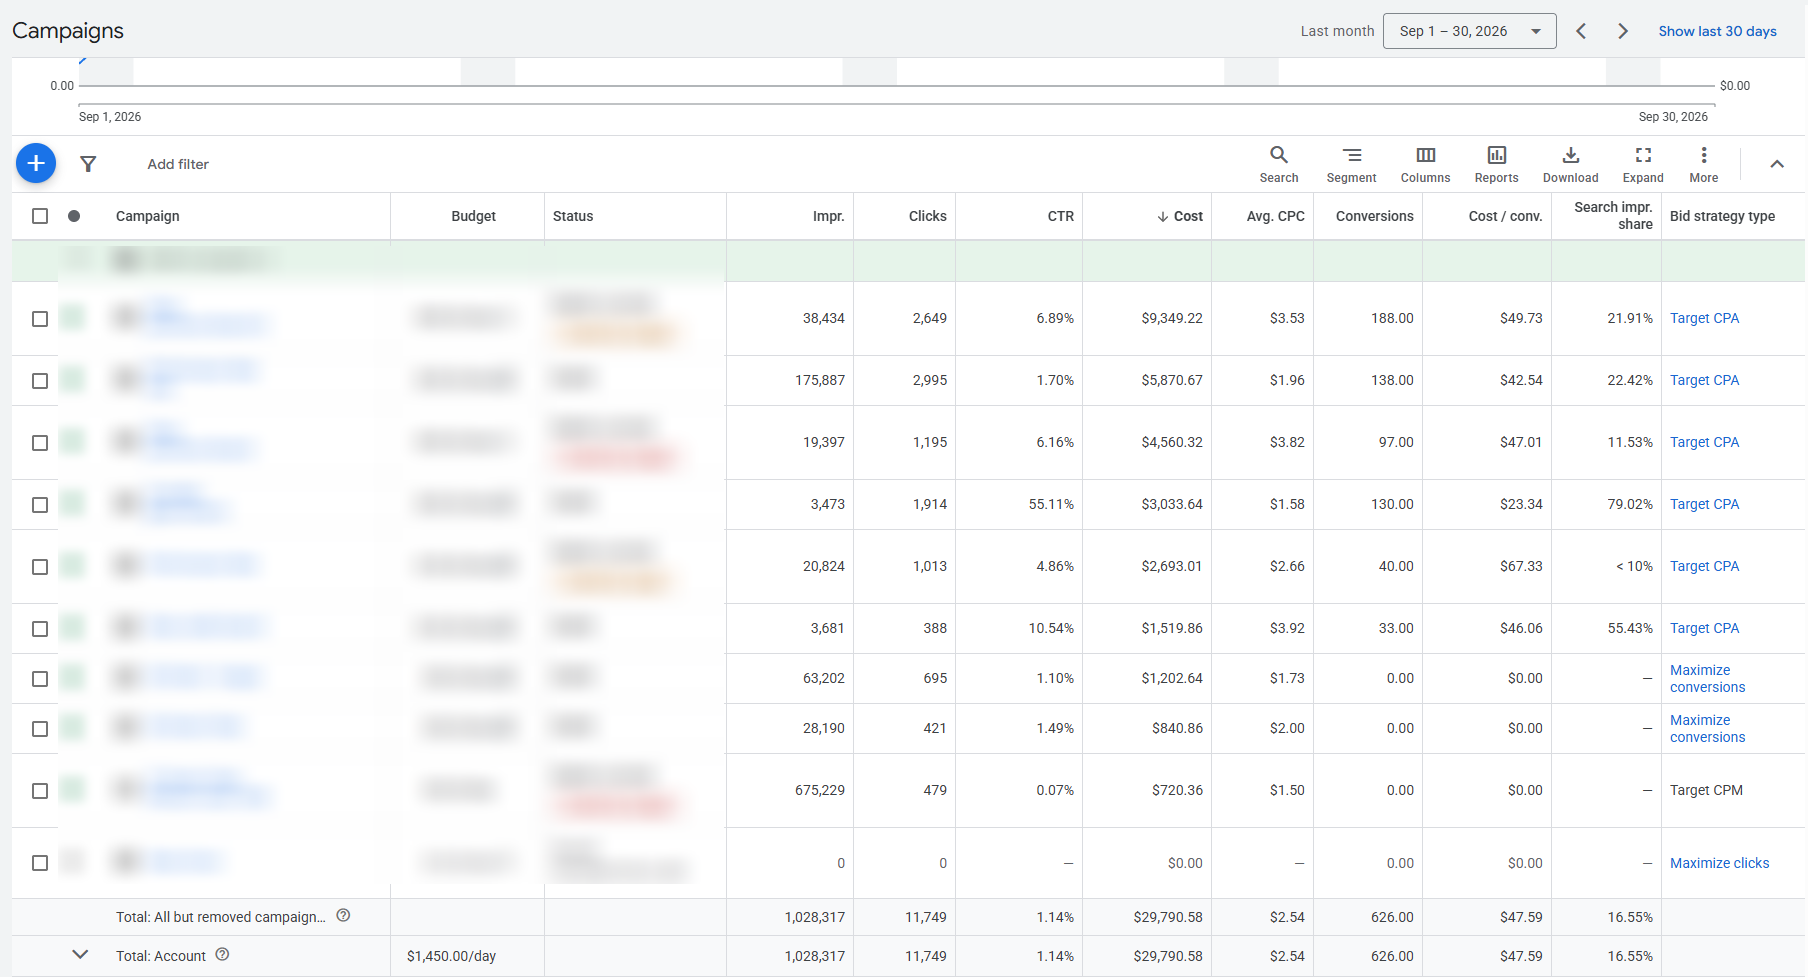
September vs August – the first full month on the new setup against the handover month. Spend went down 20% and leads went up 11%, mostly because a click cost a fifth less.
- Leads
- 566 → 626 (+11%)
- Cost per lead
- $65.56 → $47.59 (-27%)
- Ad spend
- $37,108 → $29,791 (-20%)
- Non-brand cost per lead
- $75.13 → $53.95 (-28%)
- Cost per click
- $3.20 → $2.54 (-21%)
- Main campaign cost per lead
- $80.61 → $49.73 (-38%)
05What it meant for the pipeline
Google Ads stops at the lead, and the client’s CRM stays under NDA. So this table has no modelled rates – only what the account measured, put in pipeline terms.
| Aug 2026 | Sep 2026 | |
|---|---|---|
| Non-brand leads | 447 | 496 |
| Brand share of leads | 21% | 21% |
| Cost of 626 leads | $41,041 at August’s cost per lead | $29,791 actual |
Brand stayed at a fifth of all leads, so the growth came from people who didn’t search for the company by name. At August’s prices, September’s volume would have cost $11,251 more than was spent.
06Why it worked
Leads didn’t get cheaper because more visitors filled in the form. In search, the share of clicks that became a lead barely moved – from 6.0% to 6.2%. Leads got cheaper because clicks did: the average search click fell from $3.50 to $2.66, down 24%.
The main campaign shows how. In August it brought the most leads in the account – and, at $80.61 each, the most expensive ones in search, at $4.83 a click. By the client’s own cancellation data, it also brings the cheapest completed sales. So we didn’t cut it: we reset its target and moved part of its budget to other campaigns, step by step. In September it brought 188 leads instead of 170, at $49.73 each, on 32% less spend.
Across the account, campaigns averaging more than $4 a click took 56% of the budget in August; in September, none did. Search spend fell 17%, search clicks rose 9%, and leads from search went from 560 to 626 – more clicks for less money.
Cost per lead is where an audit starts, not where it ends. The campaign with the most expensive leads was the one that sold best – switching it off would have improved the report and hurt the business.
