2.4x More Leads at a 31% Lower CPL for a B2B Coaching Brand
01The client
| Project | B2B coaching & executive education (under NDA) |
| Markets | Germany & Austria (DACH) |
| Period | Jan 2025 – Aug 2025 |
| Platform | Meta |
| Service | Paid Social – Lead Generation |
A B2B coaching and education company in DACH, selling business programmes priced from €20,000 to founders and executives. Strong organic visibility, real budget behind paid, and Meta as the main channel for new client acquisition.
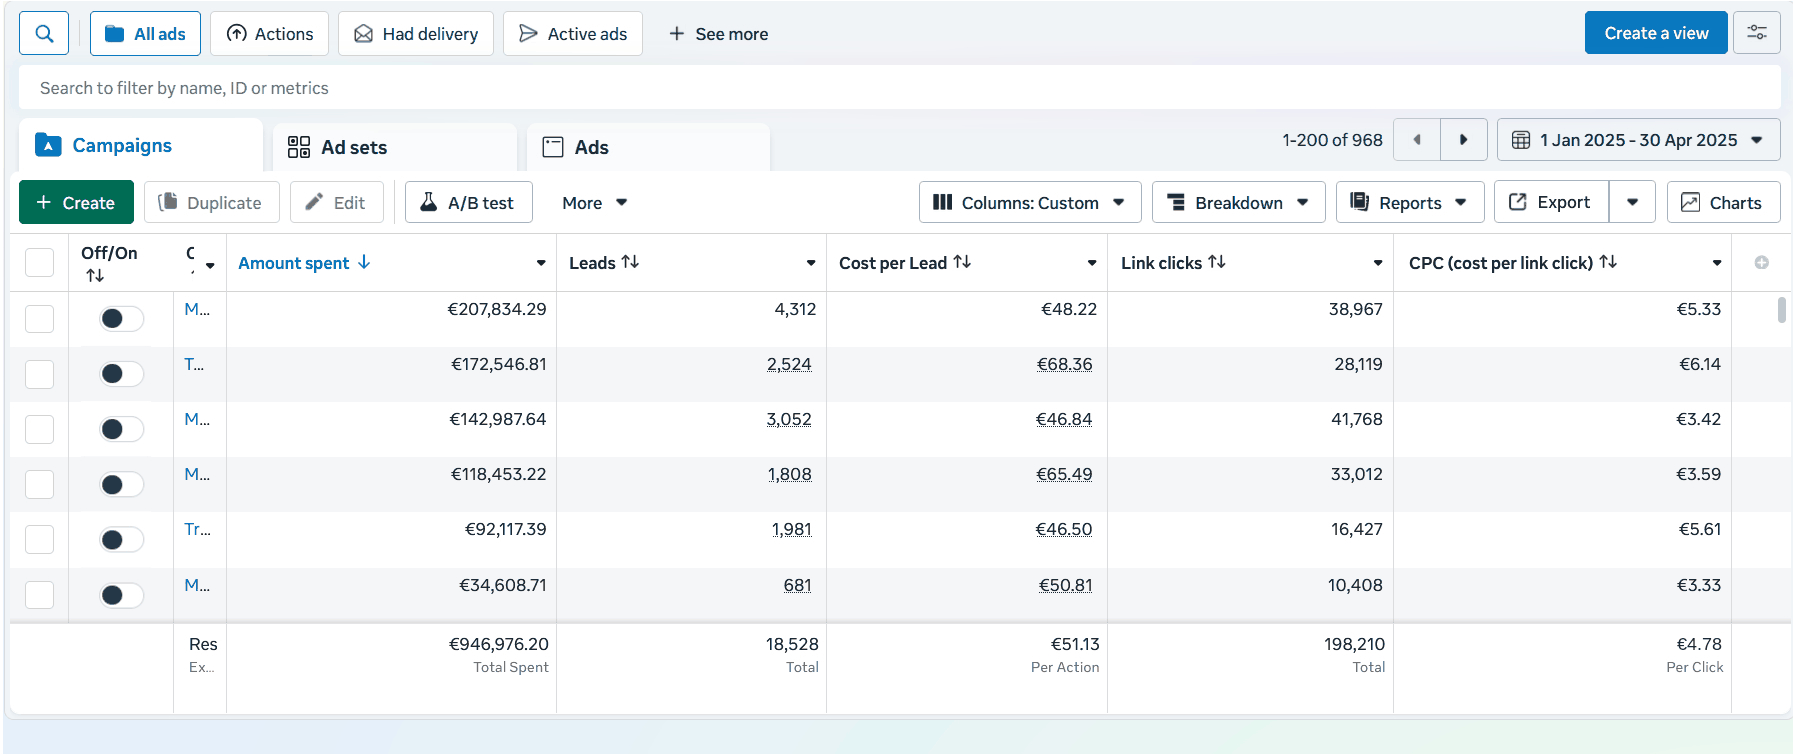
By spring 2025 the paid funnel had stopped scaling. Over four months the account spent €946,976 and produced 18,528 leads at €51.13 each. Volume held, the mix didn’t: a large share of registrations weren’t owners or decision-makers, so booked calls and closed deals lagged behind spend. And every attempt to push budget made cost per lead worse, not better.
That’s where we were brought in. The goals we agreed on:
- Bring CPL down without trading away lead quality
- Get more actual decision-makers into the funnel
- Add entry points, so the account doesn’t live or die on one funnel
- Keep the structure profitable at higher spend
02What the audit found
Before changing anything, we audited the account. Five problems, all of them structural:
- One funnel type. Everything ran through one or two webinar registration funnels. One offer, one entry point: creative fatigued fast, and the only way to grow was to push more budget at the same audience.
- Narrow targeting. Campaigns sat on interest and job-title stacks. Meta’s job-title data is unreliable – the audiences were small, they saturated quickly, and the leads still weren’t decision-makers.
- No visibility in the budget. Everything sat in CBO campaigns, so there was no way to see which audience or creative actually produced a booked call.
- Feature-led creative. Generic ads about the programme – format, modules, duration – rather than the business outcome a founder is actually buying.
- Registration built to collect. Long forms with no qualification: drop-offs on the page, and no way to sort leads by role before sales picked them up.
None of this is exotic. Together it capped the account at one offer, one audience definition and no way to tell which part was working.
03What we rebuilt
We didn’t tune the old setup – we replaced it.
- From one funnel to four. A free online book, several webinar registration funnels, Instant Forms as a test, and a direct call-booking funnel for warm traffic. The book and the webinars carried most of the volume, at the lowest cost per lead.
- Audiences opened up, not narrowed. We dropped the interest and job-title stacks and moved to broad and Advantage+ by country. Qualification moved into the funnel instead – role and company-size questions on the registration step.
- A creative angle per funnel. Growth pain, ROI, real outcomes – one line of argument per entry point, instead of one set of ads carrying everything.
- Budget split by job. ABO to test new funnels and creative on their own numbers, CBO to scale the ones already proven.
- Scaling on sales signals. Budget went up only where leads converted into booked calls and deals – not where cost per lead happened to look lowest.
04The results
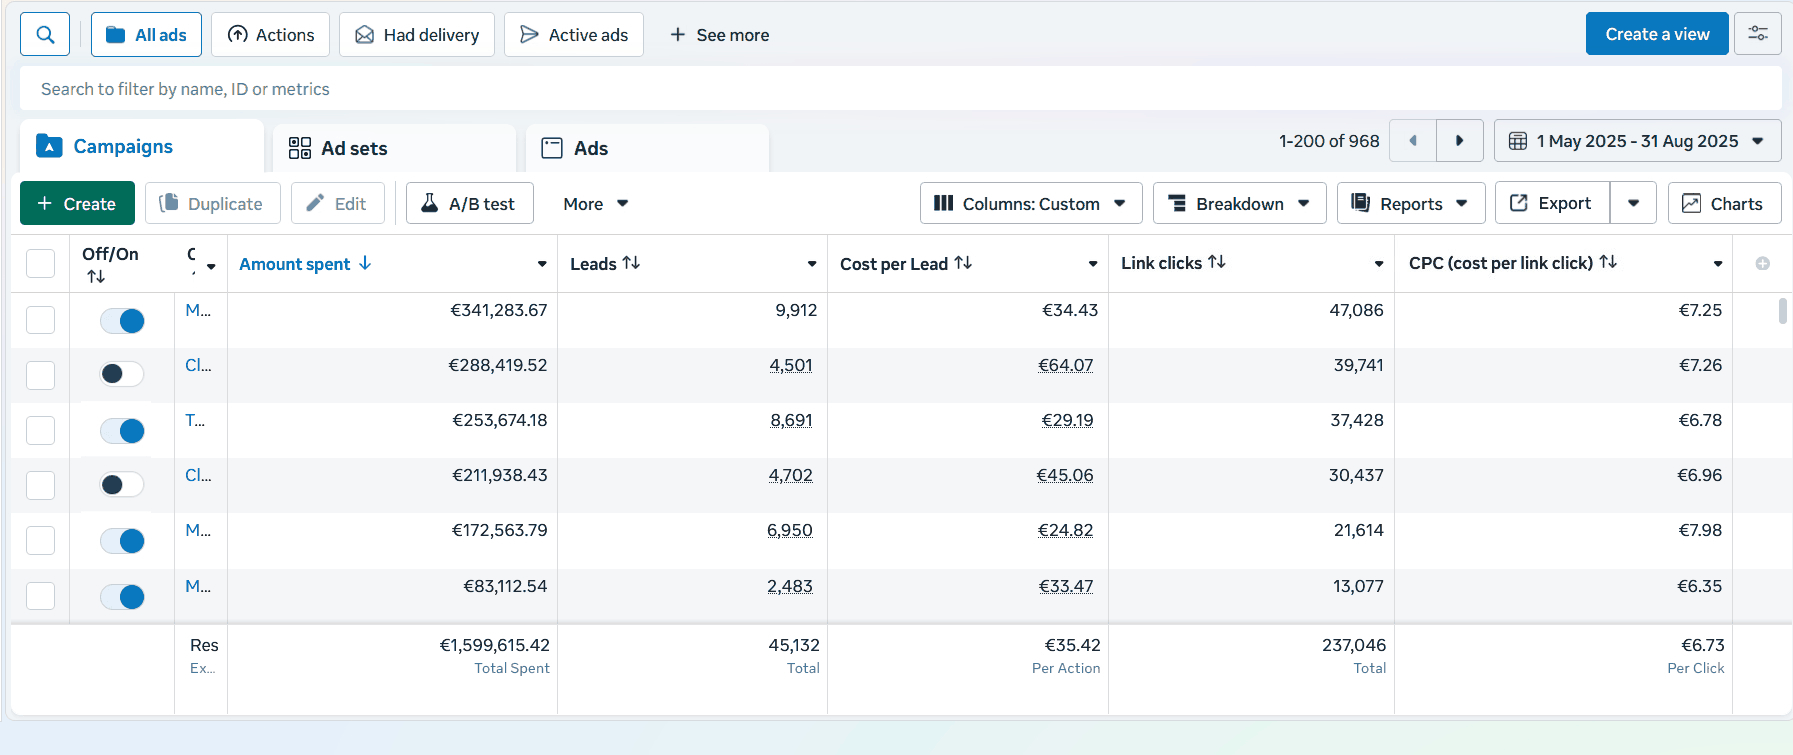
May–Aug 2025 vs Jan–Apr 2025. Spend went up 69%, leads went up 144% – because twice as many clicks turned into a lead.
- Leads
- 18,528 → 45,132 (+144%)
- Cost per lead
- €51.13 → €35.42 (-31%)
- Ad spend
- €946,976 → €1,599,615 (+69%)
- Link clicks
- 198,210 → 237,046 (+20%)
- Click-to-lead rate
- 9.3% → 19.0% (2.0x)
- Leads per €100K spend
- 1,957 → 2,821 (+44%)
05What it meant for the pipeline
Ads Manager stops at the lead. To put the change in money terms, the funnel below is modelled: benchmark conversion rates for high-ticket B2B coaching, applied to the real lead volumes. These are estimates, not the client’s CRM – the numbers in the previous section are the measured ones.
| Jan–Apr 2025 | May–Aug 2025 | |
|---|---|---|
| Decision-makers among leads | ~24% | ~41% |
| Cost per qualified lead | €217 | €86 |
| Cost per booked call | €1,087 | €438 |
| Customer acquisition cost | €14.6K | €4.6K |
| CAC as share of a €20K programme | ~73% | ~23% |
The direction is the point. At the old cost structure, acquiring one customer ate roughly three quarters of the programme price. At the new one it is under a quarter.
06Why it worked
Clicks got more expensive, not cheaper. Cost per click went from €4.78 to €6.73 – up 41% – as spend grew 69%, delivery moved toward lead optimisation, and Q2–Q3 auctions priced higher than Q1.
Cost per lead still fell 31%, because the click-to-lead rate doubled: 9.3% to 19.0%. A free book or a short webinar registration is an easier yes than a long form with no reason to fill it in – the same click now produces twice as many leads.
The counterintuitive part is the targeting. The account was built on interest and job-title stacks, which is exactly what most advertisers reach for when the leads aren’t senior enough. Narrowing was the problem, not the fix: the audiences were small, they saturated, and Meta’s job-title data was never reliable to begin with. Going broad and moving the qualification into the funnel put the filtering where it actually works – in the offer, the creative and the registration step.
If your cost per lead climbs every time you raise budget, the ceiling is usually structural: one funnel, one audience definition, and no way to see which of them is carrying the account.
